
The dominant complaint was not a single hot week. It was prolonged triple-digit heat, humidity, hot nights and months when outdoor life felt unavailable.
The corpus
A conversation larger than its headline
Weather was the clearest explanation. Culture and lifestyle came second, while cost of living and politics landed almost level. Nature access was substantial—and five additional themes emerged strongly enough to stand on their own.
0comments and nested replies
0identifiable unique authors
0authors naming a reason
0authors with firsthand context
◎
The unit is a person, not a comment. Every username was deduplicated case-insensitively across all four posts, and every reason they named was aggregated. Deleted authors were excluded because they cannot be reliably matched.
The ranking
What people named
The primary view uses 222 authors who named at least one relevant reason. Switch to the full-commenter view to see how much unrelated discussion changes the denominator.
0%25%50%
| Bucket | Authors | % reason-givers | % all commenters | Class |
|---|---|---|---|---|
| Weather | 99 | 44.6% | 17.9% | Requested |
| Culture / Lifestyle | 74 | 33.3% | 13.4% | Requested |
| Cost of Living | 53 | 23.9% | 9.6% | Requested |
| Politics | 51 | 23.0% | 9.2% | Requested |
| Nature / Sightseeing | 44 | 19.8% | 8.0% | Requested |
| Jobs / Economy | 34 | 15.3% | 6.2% | Emergent |
| Health / Environment | 31 | 14.0% | 5.6% | Emergent |
| Urban Form / Transportation | 23 | 10.4% | 4.2% | Emergent |
| Public Services / Infrastructure | 18 | 8.1% | 3.3% | Emergent |
| Security / Safety | 15 | 6.8% | 2.7% | Requested |
| Family / Social Ties | 5 | 2.3% | 0.9% | Emergent |
Reading the pattern
Not one reason.
A stack of trade-offs.
High property taxes, fees, insurance and rising housing costs challenged the premise that Austin still delivered a decisive financial advantage.
Commenters missed the combined package: coast, mountains, public land, mild climate, food, diversity, arts and proximity to established social networks.
Reproductive care, LGBTQ+ rights, religious policy and state control of Austin were repeatedly framed as lived constraints—not abstract party preference.
Return-to-office mandates, layoffs and weaker local opportunities made jobs/economy the largest category that was not specified in advance.
Traffic, car dependence, sprawl and limited walkability turned distance into a recurring quality-of-life complaint.
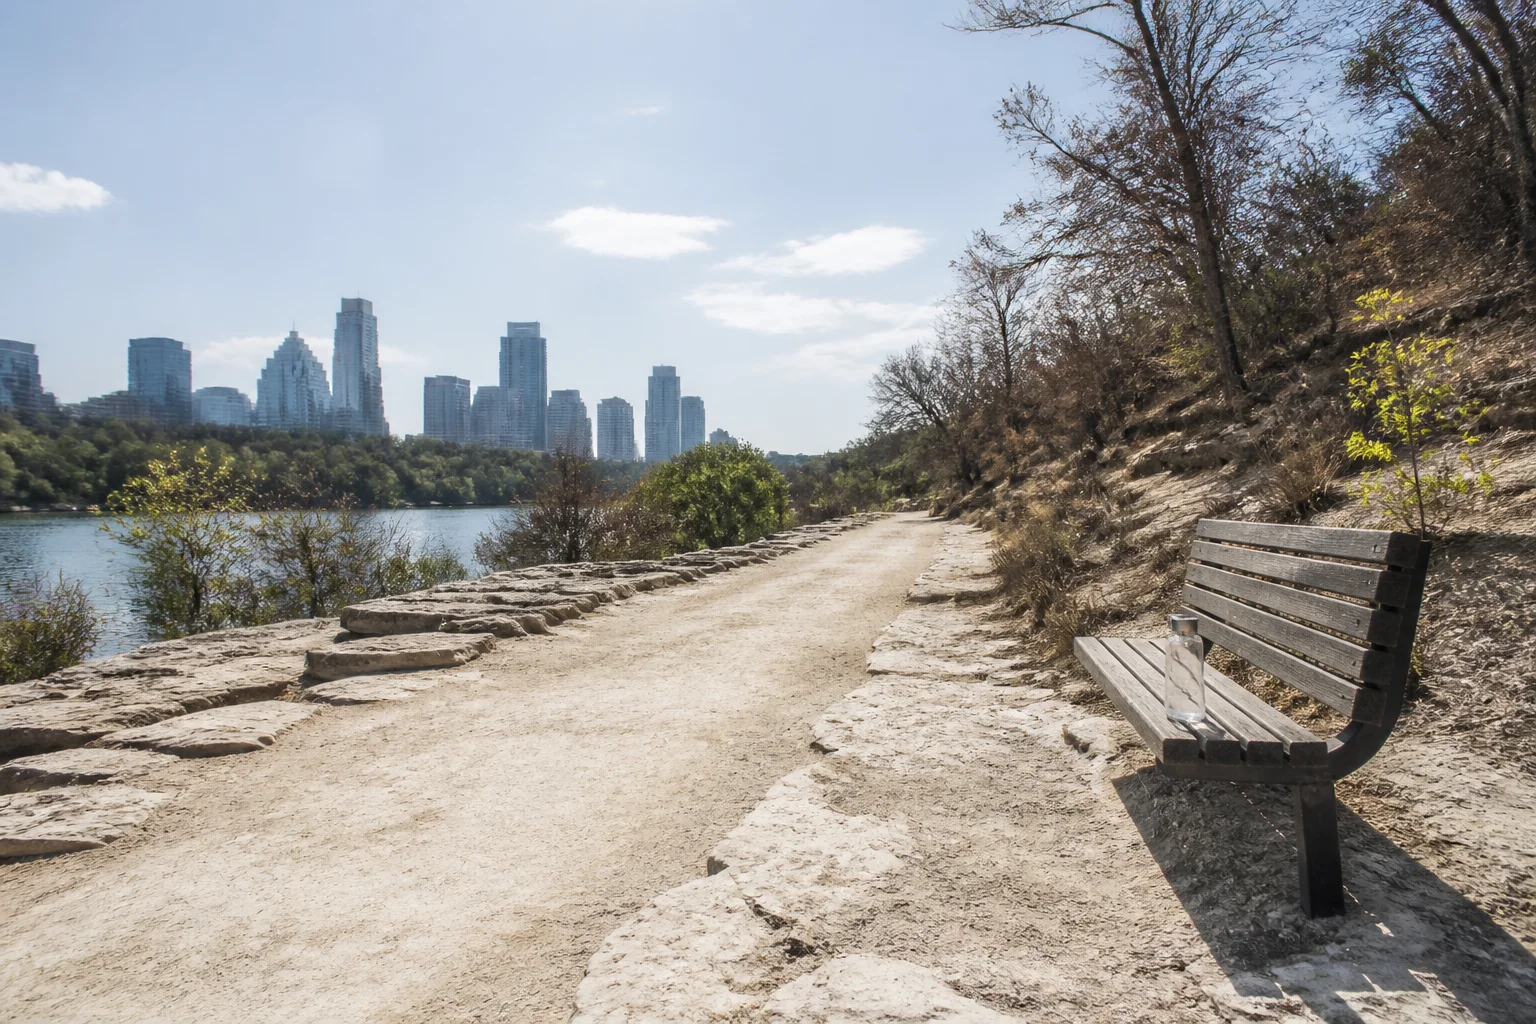
It appeared in 44.6% of reason-givers—and rose to 52% among authors who disclosed firsthand Austin or moving experience.
Original AI-generated editorial image · created for this analysis
Inside the buckets
Every concrete reason
Counts are unique authors mentioning that specific reason. A person can name several reasons within one bucket, so the subreason totals intentionally overlap.
01 WeatherRequested bucket 44.6%99 authors
Concrete reasons, counted once per author for each distinct reason.
-
extreme or prolonged summer heat5725.7% of reason-givers · 57.6% within this bucket
-
overall climate is worse than coastal California3013.5% of reason-givers · 30.3% within this bucket
-
high humidity, muggy conditions, and hot nights2812.6% of reason-givers · 28.3% within this bucket
-
volatile or severe weather, including storms, floods, and tornadoes94.1% of reason-givers · 9.1% within this bucket
-
winter cold, freezes, ice, and snow52.3% of reason-givers · 5.1% within this bucket
-
weather-linked bugs and pests31.4% of reason-givers · 3.0% within this bucket
-
dry climate and water scarcity10.5% of reason-givers · 1.0% within this bucket
02 Culture / LifestyleRequested bucket 33.3%74 authors
Concrete reasons, counted once per author for each distinct reason.
-
Inferior food quality or limited culinary variety2913.1% of reason-givers · 39.2% within this bucket
-
Fewer arts, entertainment, nightlife, and things to do167.2% of reason-givers · 21.6% within this bucket
-
Underwhelming, generic, or culturally mismatched city lifestyle135.9% of reason-givers · 17.6% within this bucket
-
Social conservatism, religiosity, prejudice, or hostility125.4% of reason-givers · 16.2% within this bucket
-
Austin lost its distinctive character through growth, corporatization, or redevelopment104.5% of reason-givers · 13.5% within this bucket
-
Less diversity, cosmopolitanism, or cultural depth104.5% of reason-givers · 13.5% within this bucket
-
California or Los Angeles has a distinctive cultural pull and quality of life94.1% of reason-givers · 12.2% within this bucket
-
Climate limits outdoor, active, or social life and encourages an indoor or drinking-centered routine62.7% of reason-givers · 8.1% within this bucket
-
Suburban isolation, sprawl, or poor access to nearby amenities20.9% of reason-givers · 2.7% within this bucket
03 Cost of LivingRequested bucket 23.9%53 authors
Concrete reasons, counted once per author for each distinct reason.
-
High or rising property taxes, including the absence of Prop 13-style protection2712.2% of reason-givers · 50.9% within this bucket
-
Austin or Texas is not materially cheaper and offers poor value relative to California188.1% of reason-givers · 34.0% within this bucket
-
No-income-tax savings are erased by other taxes, fees, or a higher effective tax burden146.3% of reason-givers · 26.4% within this bucket
-
Costs or taxes are high relative to local income, especially for nonwealthy households73.2% of reason-givers · 13.2% within this bucket
-
Everyday household expenses such as groceries, utilities, insurance, driving, and maintenance erase savings73.2% of reason-givers · 13.2% within this bucket
-
Housing, rent, or mortgage costs rose toward California levels73.2% of reason-givers · 13.2% within this bucket
-
Overall cost of living is high or rising73.2% of reason-givers · 13.2% within this bucket
-
Childcare and private-school costs are excessive20.9% of reason-givers · 3.8% within this bucket
04 PoliticsRequested bucket 23.0%51 authors
Concrete reasons, counted once per author for each distinct reason.
-
General dissatisfaction with conservative, Republican, or far-right state governance2511.3% of reason-givers · 49.0% within this bucket
-
Loss of reproductive, women's, and pregnancy-healthcare rights177.7% of reason-givers · 33.3% within this bucket
-
Objectionable leadership, corruption, institutional capture, or political dysfunction62.7% of reason-givers · 11.8% within this bucket
-
Theocratic or religious policy imposed through government or public education62.7% of reason-givers · 11.8% within this bucket
-
Loss of LGBTQ+, minority, civil, human, or other personal rights52.3% of reason-givers · 9.8% within this bucket
-
State preemption or disenfranchisement of progressive Austin and local policy31.4% of reason-givers · 5.9% within this bucket
-
Weaker labor, education, and social-policy protections31.4% of reason-givers · 5.9% within this bucket
05 Nature / SightseeingRequested bucket 19.8%44 authors
Concrete reasons, counted once per author for each distinct reason.
-
flat terrain and lack of mountains or topographic variety219.5% of reason-givers · 47.7% within this bucket
-
lack of Pacific coast, ocean, and quality beaches219.5% of reason-givers · 47.7% within this bucket
-
inferior access to year-round outdoor recreation and nearby nature167.2% of reason-givers · 36.4% within this bucket
-
inferior natural beauty and geographic or ecological diversity146.3% of reason-givers · 31.8% within this bucket
-
scarce or degraded public land, parks, hiking, and camping52.3% of reason-givers · 11.4% within this bucket
06 Jobs / EconomyEmergent bucket 15.3%34 authors
Concrete reasons, counted once per author for each distinct reason.
-
Local job opportunities are scarce, deteriorating, or less plentiful than expected135.9% of reason-givers · 38.2% within this bucket
-
Return-to-office mandates or the loss of pandemic remote-work flexibility forced relocation73.2% of reason-givers · 20.6% within this bucket
-
A job offer, work location, or stronger outside market directly enabled or required departure62.7% of reason-givers · 17.6% within this bucket
-
Austin or Texas salaries are lower than California earnings52.3% of reason-givers · 14.7% within this bucket
-
Austin's tech ecosystem is shallower or offers lower-quality work than California52.3% of reason-givers · 14.7% within this bucket
-
Tech contraction, layoffs, or employer closures eliminated local work52.3% of reason-givers · 14.7% within this bucket
-
Racial discrimination prevented employment10.5% of reason-givers · 2.9% within this bucket
07 Health / EnvironmentEmergent bucket 14.0%31 authors
Concrete reasons, counted once per author for each distinct reason.
-
bugs, mosquitoes, cockroaches, scorpions, and other pests167.2% of reason-givers · 51.6% within this bucket
-
restricted or dangerously delayed reproductive and maternal healthcare83.6% of reason-givers · 25.8% within this bucket
-
severe allergies, cedar pollen, and mold41.8% of reason-givers · 12.9% within this bucket
-
pollution, toxic water, and weak environmental protections31.4% of reason-givers · 9.7% within this bucket
-
inferior medical care or poor accommodation of health needs20.9% of reason-givers · 6.5% within this bucket
-
return of preventable diseases and invasive health threats20.9% of reason-givers · 6.5% within this bucket
08 Urban Form / TransportationEmergent bucket 10.4%23 authors
Concrete reasons, counted once per author for each distinct reason.
-
Car dependence, sprawl, long distances, and lack of walkability104.5% of reason-givers · 43.5% within this bucket
-
Severe traffic, congestion, or overcrowding104.5% of reason-givers · 43.5% within this bucket
-
Homogeneous big-box, strip-mall, or isolated suburban development41.8% of reason-givers · 17.4% within this bucket
-
Public transit and transportation infrastructure are inadequate or unreliable41.8% of reason-givers · 17.4% within this bucket
-
Road design or driver behavior makes travel unpleasant20.9% of reason-givers · 8.7% within this bucket
-
Airport access is inconvenient10.5% of reason-givers · 4.3% within this bucket
09 Public Services / InfrastructureEmergent bucket 8.1%18 authors
Concrete reasons, counted once per author for each distinct reason.
-
unreliable electric grid, power shortages, and outages73.2% of reason-givers · 38.9% within this bucket
-
poor public schools and education governance62.7% of reason-givers · 33.3% within this bucket
-
missing or weak public, civic, and family-support services31.4% of reason-givers · 16.7% within this bucket
-
roads, schools, and buildings poorly withstand extreme weather20.9% of reason-givers · 11.1% within this bucket
-
shortage of doctors, teachers, and timely specialist care20.9% of reason-givers · 11.1% within this bucket
10 Security / SafetyRequested bucket 6.8%15 authors
Concrete reasons, counted once per author for each distinct reason.
-
lethal pregnancy and women's safety risks created by healthcare laws52.3% of reason-givers · 33.3% within this bucket
-
prevalence of guns and open-carry culture52.3% of reason-givers · 33.3% within this bucket
-
racial, identity-based, immigration, or origin-based harassment and legal threats52.3% of reason-givers · 33.3% within this bucket
-
property crime and unsafe streets or transportation10.5% of reason-givers · 6.7% within this bucket
11 Family / Social TiesEmergent bucket 2.3%5 authors
Concrete reasons, counted once per author for each distinct reason.
-
Desire for proximity to family, longtime friends, and a familiar support network31.4% of reason-givers · 60.0% within this bucket
-
Austin or Texas viewed as unsuitable for raising children20.9% of reason-givers · 40.0% within this bucket
Sensitivity check
What firsthand authors emphasized
Fifty authors disclosed some firsthand status: a self-described returnee, someone who left Austin, or a current/former resident. Weather became even more prominent, while the broad ordering remained recognizable.
Only nine explicit Californian returnees
That sample is too small for stable percentages. Weather appeared for 4; culture/lifestyle and jobs/economy for 3 each; cost, family, health and nature for 2 each.
| Bucket | Authors | % of 50 |
|---|---|---|
| Weather | 26 | 52.0% |
| Culture / Lifestyle | 21 | 42.0% |
| Politics | 16 | 32.0% |
| Nature / Sightseeing | 11 | 22.0% |
| Urban Form / Transportation | 9 | 18.0% |
| Health / Environment | 8 | 16.0% |
| Cost of Living | 7 | 14.0% |
| Jobs / Economy | 6 | 12.0% |
| Public Services / Infrastructure | 5 | 10.0% |
| Security / Safety | 5 | 10.0% |
| Family / Social Ties | 3 | 6.0% |
Method & limits
What this can—and cannot—tell us
Audit the work
Download the human-readable report or the author-level evidence and validation data.
Analysis MarkdownCoding JSON- Eligibility. Authors had to affirmatively name a relevant reason. Pure questions, jokes, rejected reasons and unrelated discussion were excluded.
- Multi-label by design. Someone naming heat, property taxes and politics counts once in each bucket. Percentages therefore do not sum to 100%.
- Dates. The four near-identical threads were posted in June 2026; included comments run from June 9 to July 11. Comments do not consistently date moves to 2025, 2026 or earlier.
- Identity is self-reported. Most commenters were not verified Californian returnees. Firsthand labels rely only on what users disclosed.
- Not a migration estimate. These are shares of reasons mentioned in four Reddit discussions, not measurements of the wider Californian migrant population.
- Reproducible coding. The companion JSON retains each deduplicated author, assigned buckets, exact reasons and supporting evidence, with complete subreason coverage validation.